N24 Manufacturing Report
Would you like to gather information on product quantities produced by your employees on a given day? Are you able to provide your customers with a realistic delivery date of ordered goods? Are you aware of the exact production cost of a specific product? With the right tools, you can obtain key data that will help you manage production more effectively.

What is the N24 Manufacturing Report?
The manufacturing report provides complete information, presented in visually pleasing, graphical form. It is based on data obtained from the ERP system, Microsoft Dynamics 365 Business Central. Developed in Microsoft Power BI, a class leading Business Intelligence application, allowing monitoring of production processes, specific workgroups and tools. Power BI will help in controlling processes at every stage of production and eliminate possible risk factors.
Who is the solution for?The solution is primarily intended for production managers and production planners. The report shows the necessary information in a clear, visually appealing way, providing information, such as: how many orders have been delayed, how many were executed on time, and how many were executed ahead of schedule. An interesting option is the ability to analyse the quantity produced in relation to the efficiency of the machine or other production resource.
Key functionality of the N24 Manufacturing Report
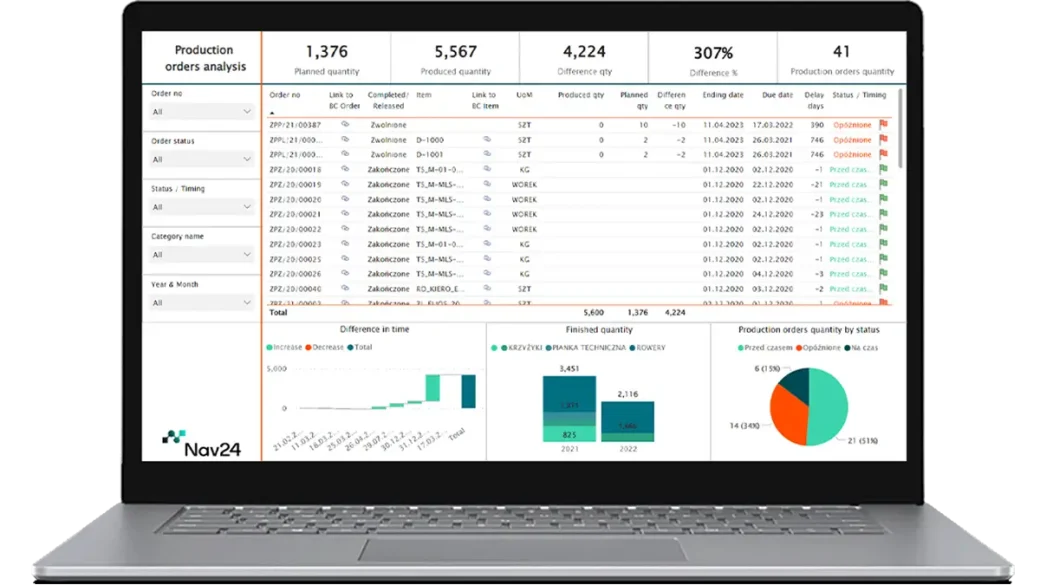
- Analysis of production orders over time. The report allows you to track information on planned and realised quantities of products and production orders, on a continual basis. This allows the user to observe and compare the progress of orders, based on the planned amount and quantity already produced. The user can filter data by order status, date or product category.
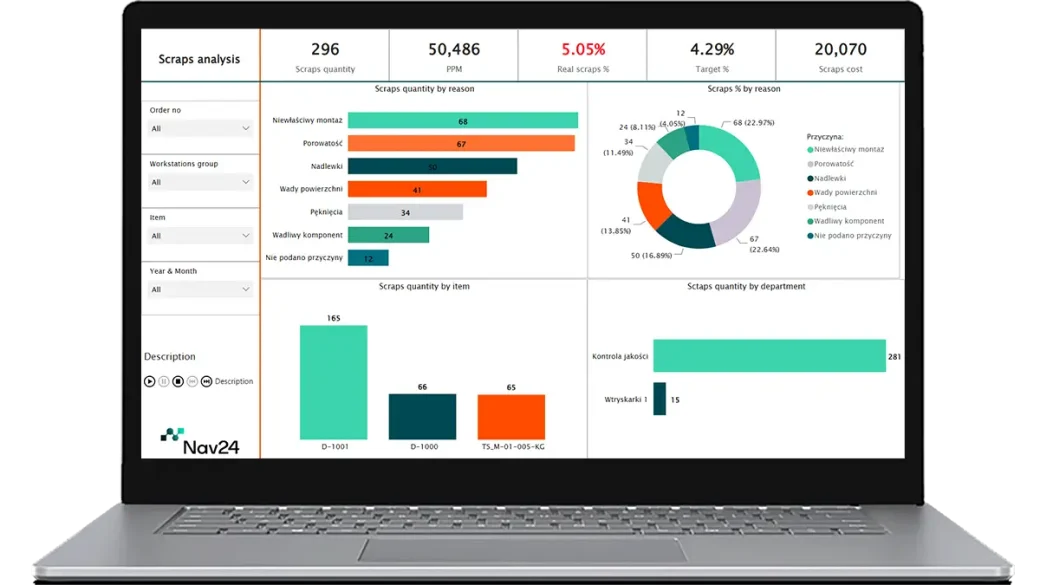
- Analysis of deficiencies and analysis of deficiencies over time. The report allows for the analysis of deficiencies arising at individual stages of the production process. The analysis of deficiencies over time allows you to observe a regress in terms of the percentage level of deficiencies in a given period. This value shows how the company is dealing with shortages. For example, in July 2022, the percentage of shortages on time was 20%. However, in February 2023 it was only 4%.
- Production cost analysis The report allows easy analysis of production costs from a stock and production orders perspective. Based on the cost analysis, you can easily compare the normative cost with the actual cost, resulting from real data. Cost variances can be analysed on three levels: material cost, production capacity and the cost of subcontractors. Due to this, you will avoid the situation of unwittingly selling products for below the cost of production.
- Machine productivity This function supports production managers in particular, as they will be able see which specific machine is currently available, and which is heavily loaded. By analysing the work on a given work cell, they can also see the efficiency of a given machine. This allows quick reactions and timely execution of orders, with the possibility of accelerating them.


N24 Manufacturing Report - practical usage
The production report, you gain access to the most up-to-date production data. In most cases, it is presented using tables and graphs, which significantly speeds up analysis. You can also narrow your search by specific criteria and customise it to find exactly what you're looking for. The report is available online, so even if you are not on-site, access and insight into data is easily accessible. Data can be exported to PDF, Power Point and Excel. The solution is easy to integrate, hence data can be combined from many sources, e.g. Power Apps, Excel or Sharepoint. There is no risk of human error when entering data, and the information is always up to date.
Make an appointment for a free, no obligation consultation
Would you like to learn more about the N24 Manufacturing Report or other N24 products? Contact us today and our consultants will offer advice on the most effective solutions for your company.
Show phone...