
Power BI

Data visualisation in the form of reports and analyses
Modern enterprises generate vast amounts of data which can be used as a valuable source of information.
Various sources, complexity and the size of datasets make analyses extremely difficult. A lack of data visualisation further complicates interpretation and, as a result, the right business decisions become much more difficult to make.

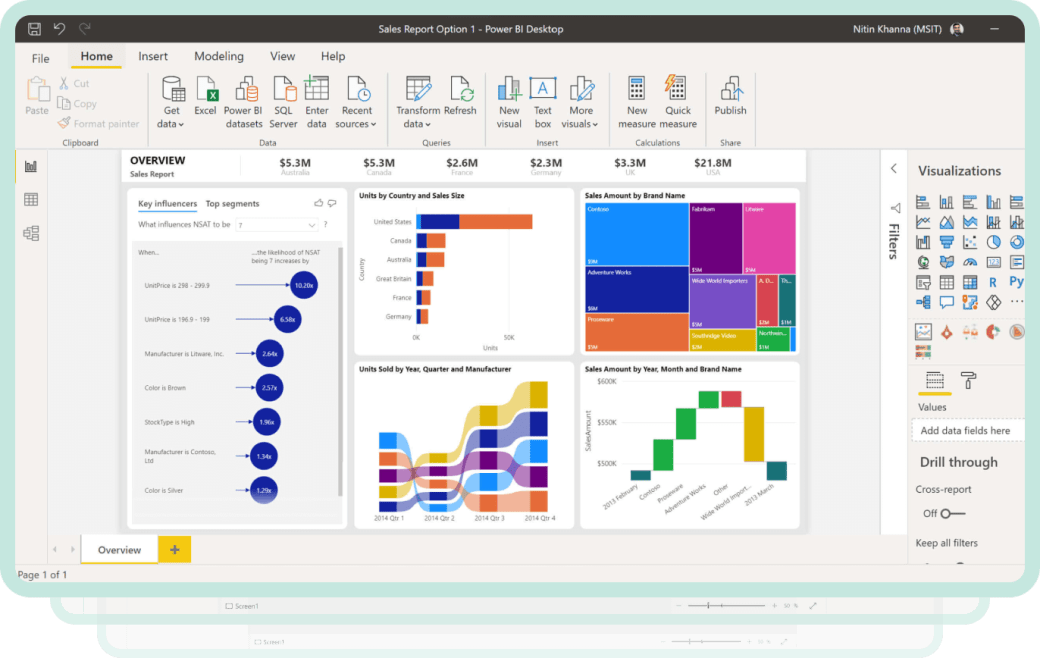
Power BI is a set of business intelligence tools, available in the Microsoft cloud, that allows you to combine data from various sources and visualise it in the form of reports and interactive analysis.
The properly secured mechanisms for storing and automatically updating data, built into the Power BI service, ensure that users always receive up-to-date reports in a short time.

Why should you use Power BI?
Stay updated
The data is updated automatically according to a set schedule. You can subscribe to individual reports in the form of email messages, and set alerts for changes in KPI's so that you can react in a timely manner.
Easily analyse the data that matters to you
Specific data visualisation provides easy to interpret results, making it simpler to draw valuable conclusions. Power BI provides interactive, multidimensional reports that can contain various types of charts, maps and diagrams. Data can be combined into groups/clusters and filtered, depending on your needs. Built-in artificial intelligence capabilities help create clear data visualisations.
Create your own reports
The Power BI platform allows you to easily create reports using the "drag and drop" method, and the rich library of templates will make your task even easier. You can also edit the appearance of the reports to your liking.
Manage data access
You can assign permissions and roles to individual reports so that specific people have access to the information they need.
Keep your analytical data protected
Industry-leading data security features such as confidentiality labels, encryption, and Microsoft Cloud App Security will help protect sensitive data effectively.

The above research was carried out by the independent institution Gartner (gartner.com)
Combine data from different areas of your business
Thanks to specific reports, you gain insight into the global situation of your company, or selected areas of its operation. Control key data for your business and quickly react to unplanned changes.
Integrate reports with your ERP system
The Power BI service is an integral feature of the Dynamics 365 Business Central ERP system. You can access reports directly from the BC Dashboard.
Connect multiple data sources
Power BI reports can collect data from many different systems, including: Google Analytics, Excel, Salesforce, Marketo, etc. This allows you to have the necessary, and up-to-date, information in one place, without having to switch between programs.
Share reports in the format of your choice
Data from Power BI reports can be exported to Excel, PowerPoint and shared via SharePoint. You can also embed reports in existing applications or websites.
Analyse data across multiple devices
Power BI reports are optimised for mobile devices, so you can analyse data on the move.
Invest in the Business Intelligence leader
The Power BI platform was recognised as a leader in the Gartner® Magic Quadrant 2022 report on Business Intelligence analytical platforms.

Check what reports our clients use
You can use ready-made reports or we can prepare a customised report, that takes into account the needs of your organisation.
N24 Manufacturing Report
Find out moreN24 Sales Report
Find out moreN24 Production Shortage Report
Find out moreN24 Inventory Control Report
Find out moreN24 Financial Management Dashboard
Find out moreOverall Equipment Effectiveness (OEE) Report
Find out moreAre you interested in the Power BI service?
Would you like a customised report created for your company?
Find out how Power BI can help your company
